
3 posts

Why to Analyse Logs?
In the modern world, business applications continue to evolve, the log data generated becomes huge and complex and file that store the logs continue to grow. To get the meaningful data out of the large chunks of generated data, log analytics tools help in extracting the data as desired. The analysis will also help in deriving the metrics about an application and its performance over a period.
Log Analysis is used to collect, index and store massive amounts of data from any source deployed in the cloud. Since each log file includes audit information and we can use the dashboards to analyse the collected log data and compare results specific to business needs.
Further, log analytics tools can help in identifing the root cause of an issue and consequently give the admins a chance to prevent such issues from occurring in the future. When a problem occurs, the critical concerns are:
Identifying the log file which contains the issue
Locating the server
Searching for the data (e.g., timestamp, version, etc.)
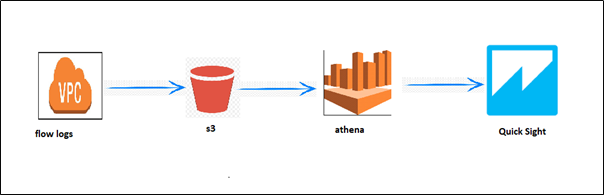
AWS services leveraged for log analytics and visualization:
Amazon Simple Server Storage (S3) is a storage service that can be used to store and retrieve any amount of data
Amazon Athena is a query service that makes it easy to analyse data directly from files stored in S3 using standard SQL statements
Amazon QuickSight helps to build interactive visualizations, perform ad-hoc analysis, and get useful business insights from various data sources hosted on the AWS infrastructure
How to build a Serverless Architecture for log analysis?
The following are the steps for building the solution for log analytics on AWS.
Step 1: Upload your log files to S3
The logs generated are uploaded to S3 for further processing. Create a S3 bucket in your AWS account.
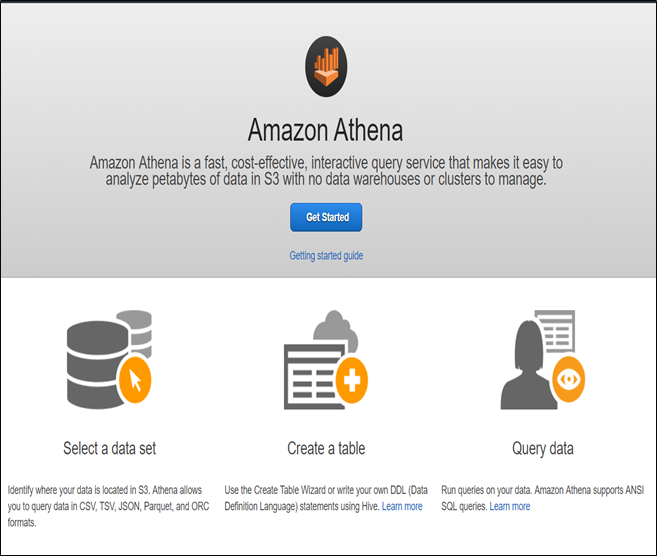
Step 2: Create tables in Athena
Athena is used to analyse the data by querying the source datasets.
Open the AWS Management Console and type ‘Athena’ in AWS Services search box. Once you find Athena, click on ‘Get Started’.
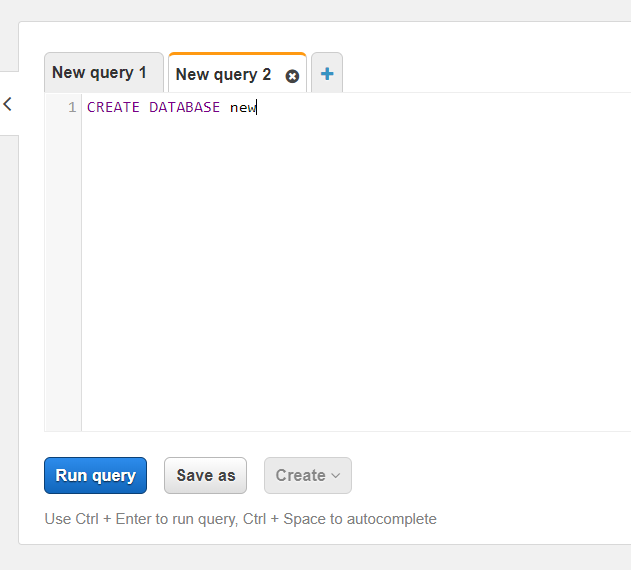
Using the Query Editor, run the command CREATE DATABASE <database_name> to create a new database. You can save the command by clicking the ‘Save as’ option for future use.
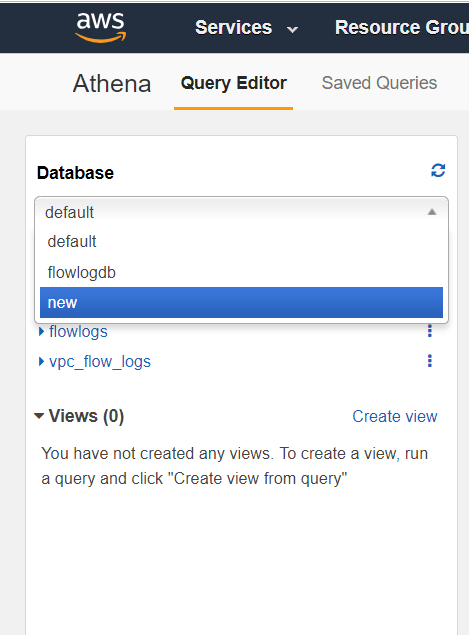
Once the query is executed, the new database will appear in the drop-down menu on the left side of your screen. Now select the database that you created.
Create a new Table for the files in S3 as below:
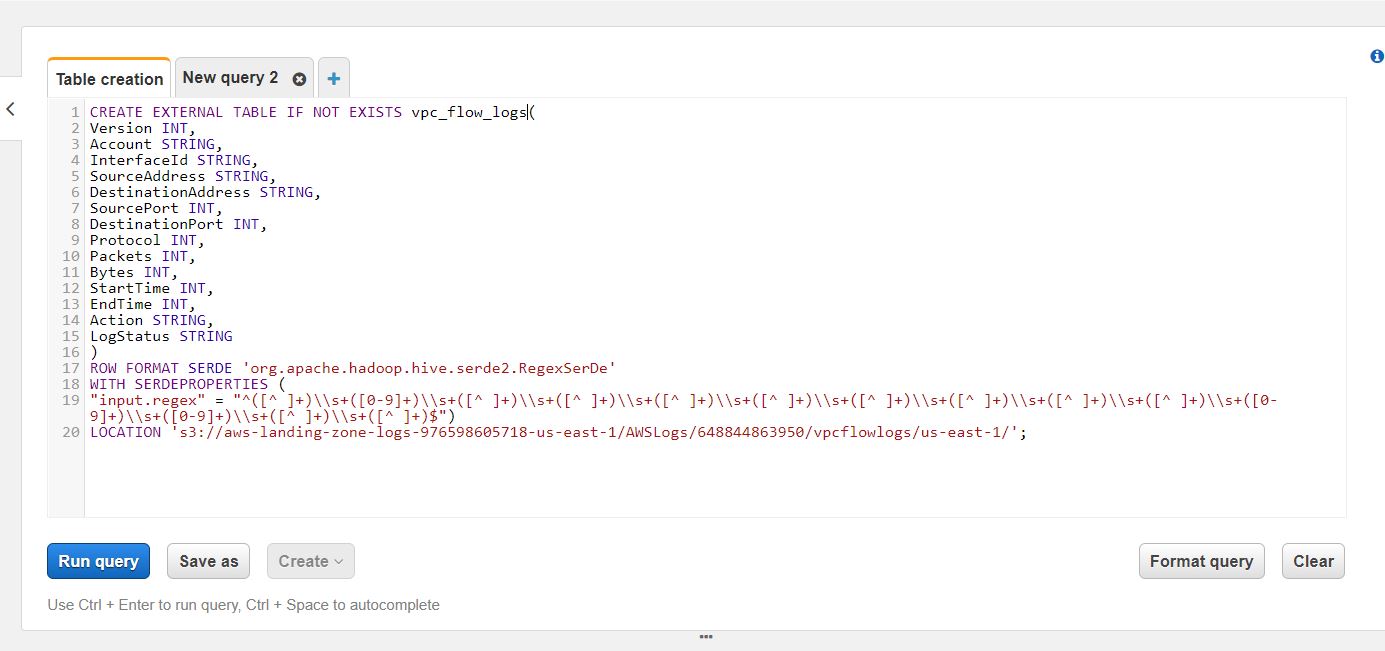
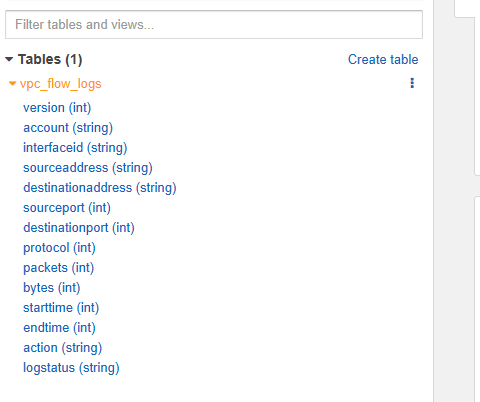
Once you create the table, verify it by browsing for the table on the left-side panel.
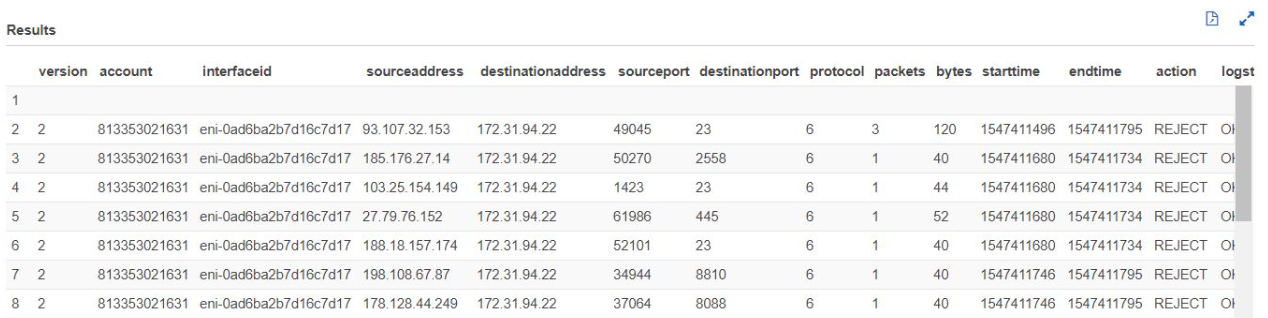
To load all partitions of the table, run the command - MSCK REPAIR TABLE <table_name>. After creating the table, you can run various queries to investigate your logs.
For E.g. select * from <table_name>
After receiving confirmation on data access via Athena, the next step is to visualize the data using QuickSight.
Step 3: Visualizing Data in QuickSight
Select ‘Quicksight’ from the AWS search bar.
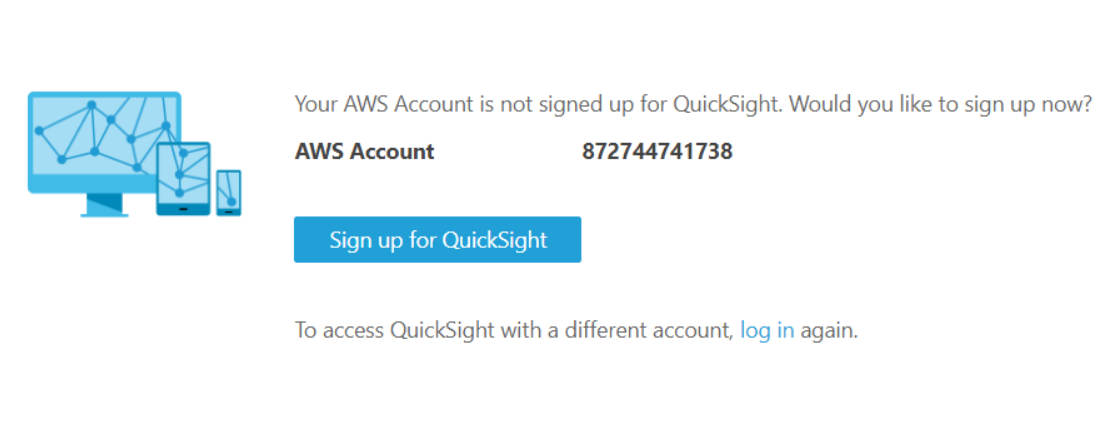
Select the relevant QuickSight edition based on your requirement. Here in this example, we will go with the standard edition for the demo.
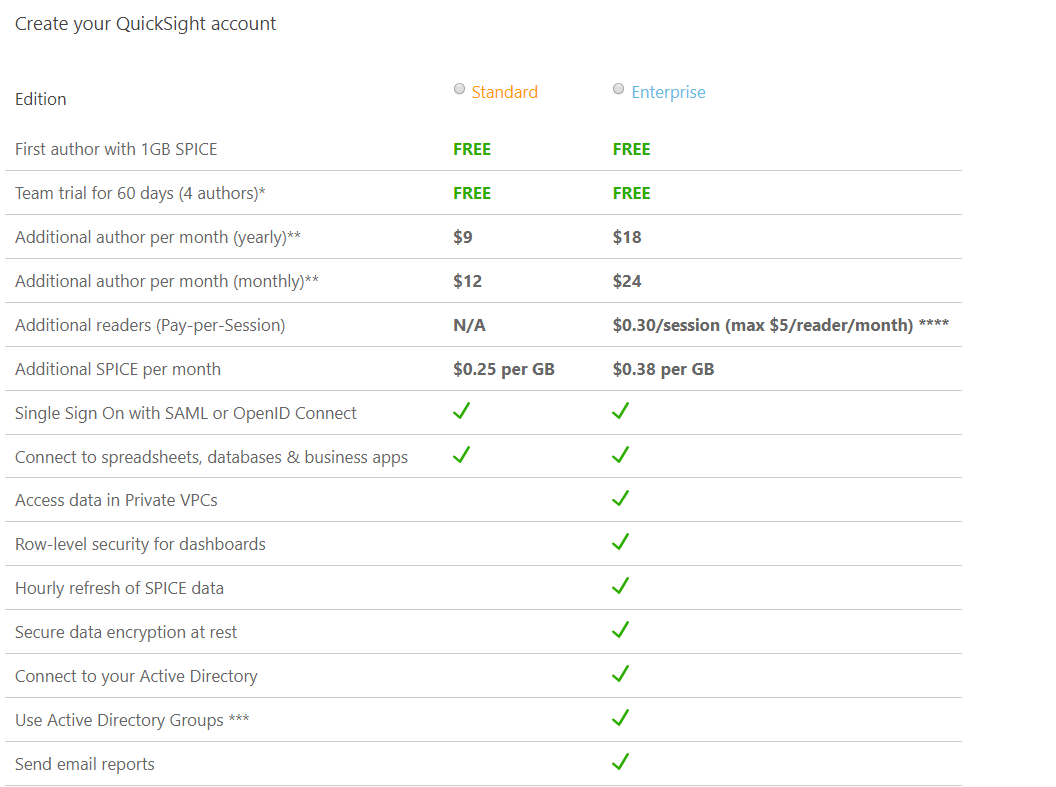
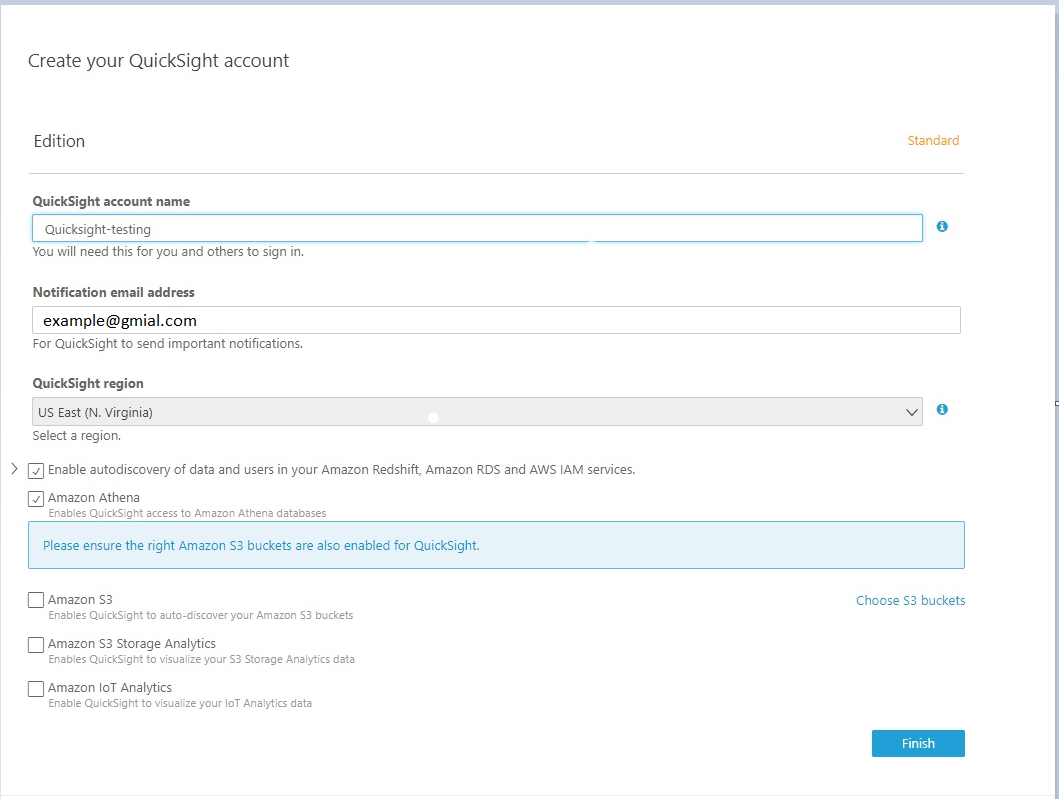
After selecting the QuickSight edition, click on ‘Continue.’ You will then be directed to the web page shown below. Fill the necessary details and click ‘Finish.’
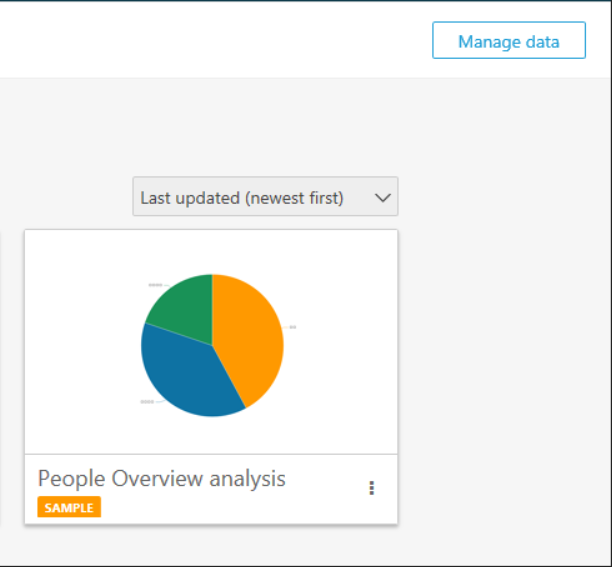
After creating the QuickSight account from the QuickSight home page, click ‘Manage data’.
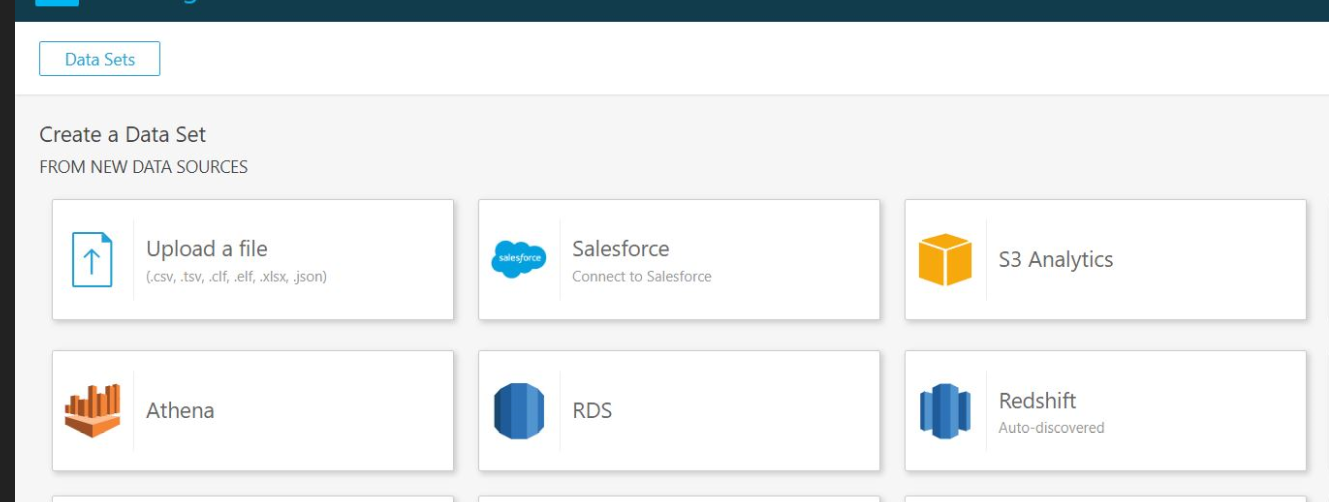
Select the ‘New data set’ option as below.
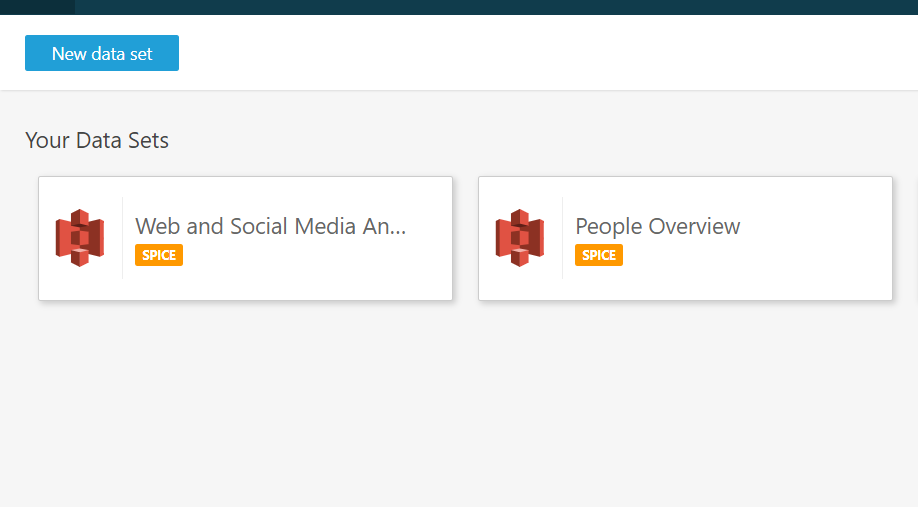
Now select the ‘Athena’ option from Data Sets.
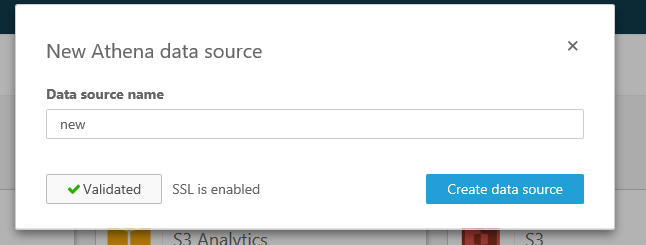
For the data source name, enter the same name as the ‘Athena’ database and click ‘Validate’ to connect QuickSight to Athena. After validation, click ‘Create data source.’
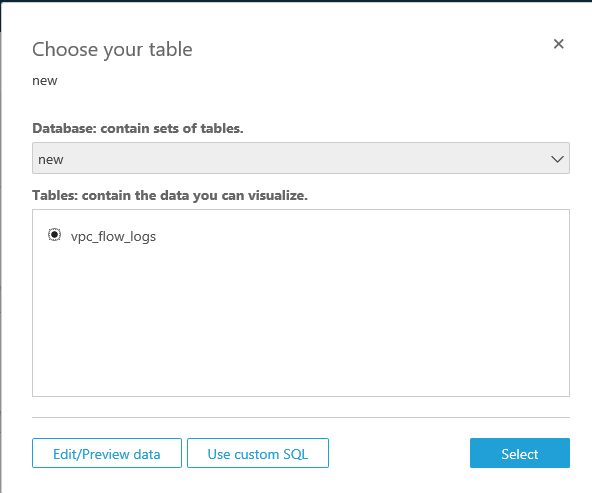
Select the database and table from the following window. Click on ‘Edit/preview data.’
Here you can change the following variables as below:
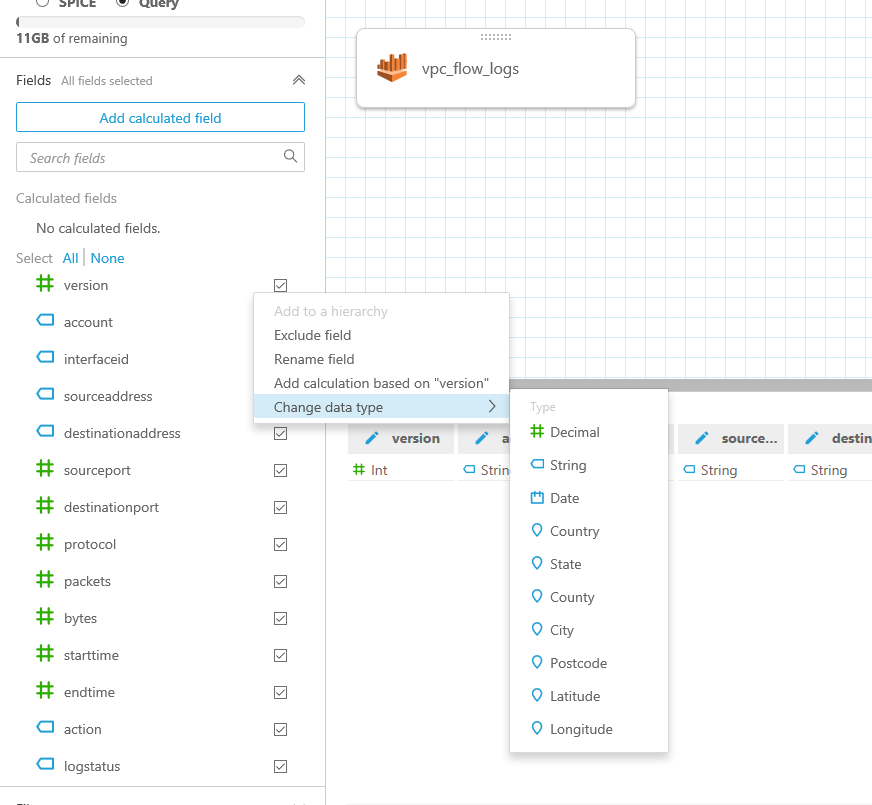
After completing the changes, click ‘Save and Visualize’. You can now view the QuickSight dashboard as depicted in the below diagram. Here, you can create your dashboard by adding visuals.
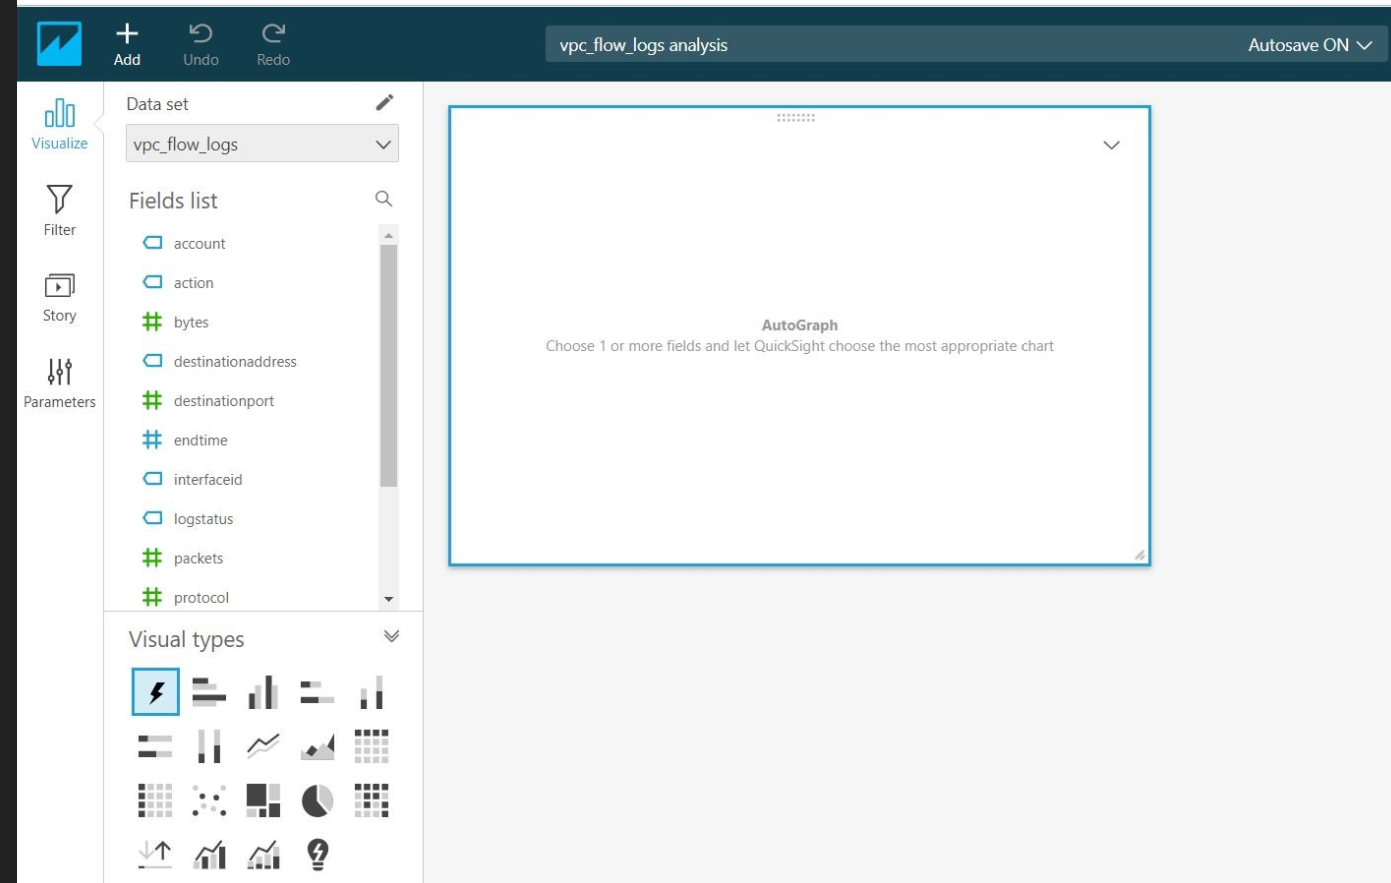
Choose Add on the application bar, and then choose Add visual. Select the fields to use from the Fields list, pane at left. Then create a visual by choosing a visual type.
You can also customize the visuals per your requirements.
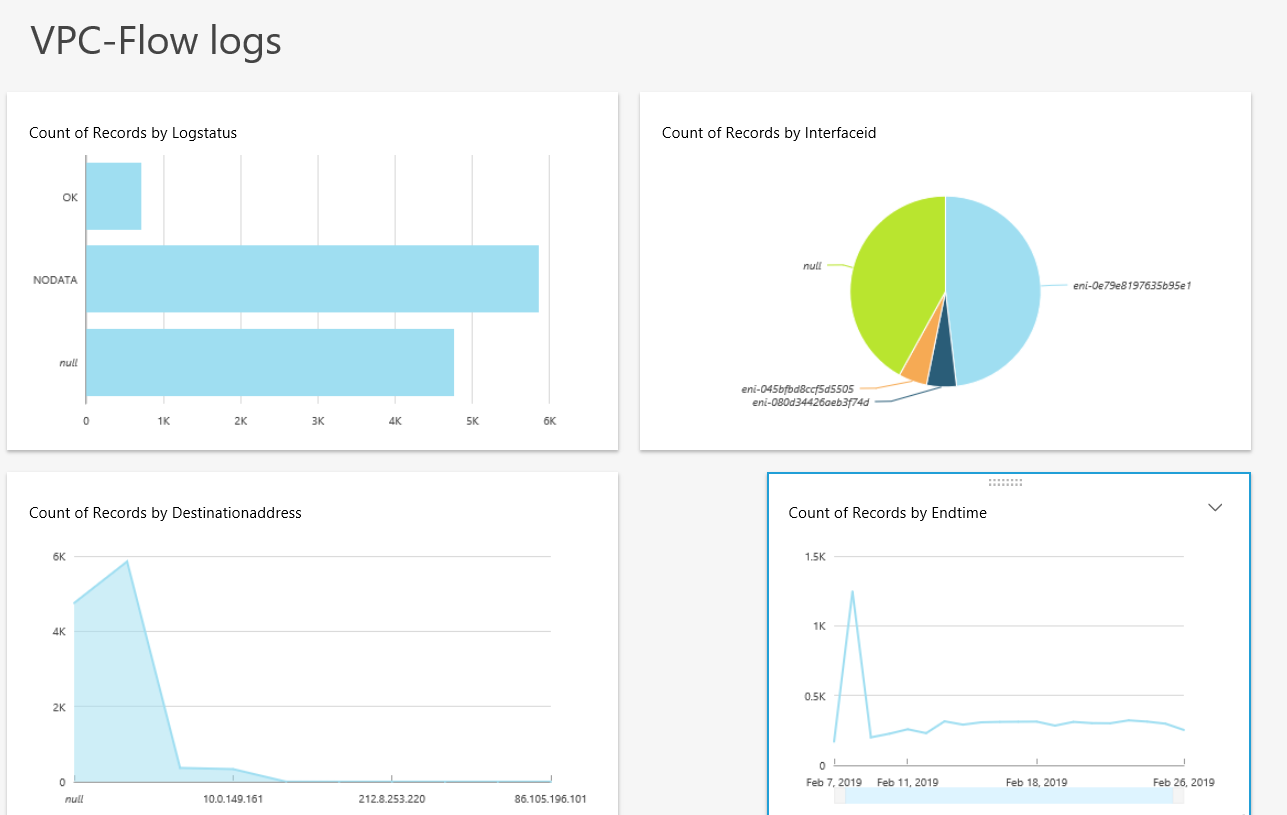
Conclusion:This is how we can leverage the AWS services to process, analyse and visualize the logs generated from different sources of log data.
Please log in to leave a comment.

Share your experience with working code.